what it is
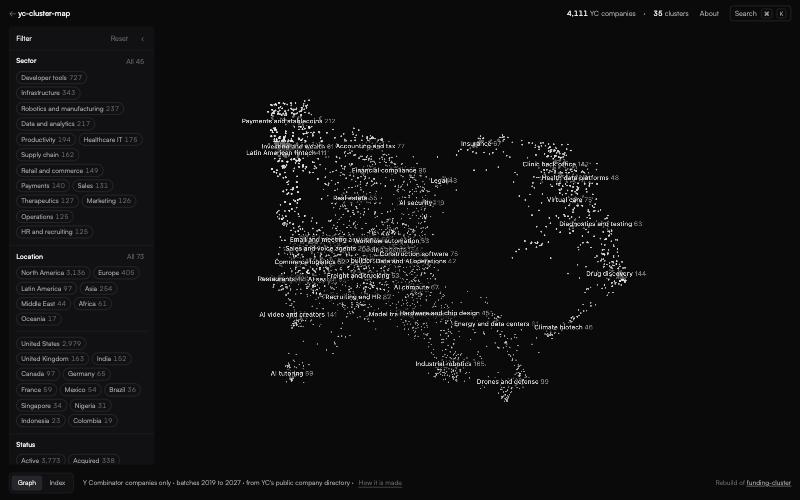
A 3D map of every Y Combinator company since 2019. Companies that describe themselves in similar terms sit close together, so you can see at a glance which themes YC keeps funding, which are new and how each batch shifts the picture. I built the 3D rendering, the filters and the index view in my own code.
how it works
- Company descriptions from YC's public directory are embedded with a sentence model, projected to 3D and clustered into 35 groups
- Drag to rotate, scroll to zoom, click a cluster label for its stats or a dot for the company and its nearest neighbours
- Filters by sector, location, status, team size, customer type and business model, with live counts
- Index view lists every company in view as a sortable table, ⌘K searches names and descriptions
what it shows
The newest clusters grow fastest: industrial robotics (65%), model training (62%) and coding agents (48%) have about half or more of their companies in the 2025 and 2026 batches, while payments peaked in 2021.
skills
data visualisation · embeddings · clustering · javascript